
Analytics
Portfolio-wide KPIs, charts and AI insights.
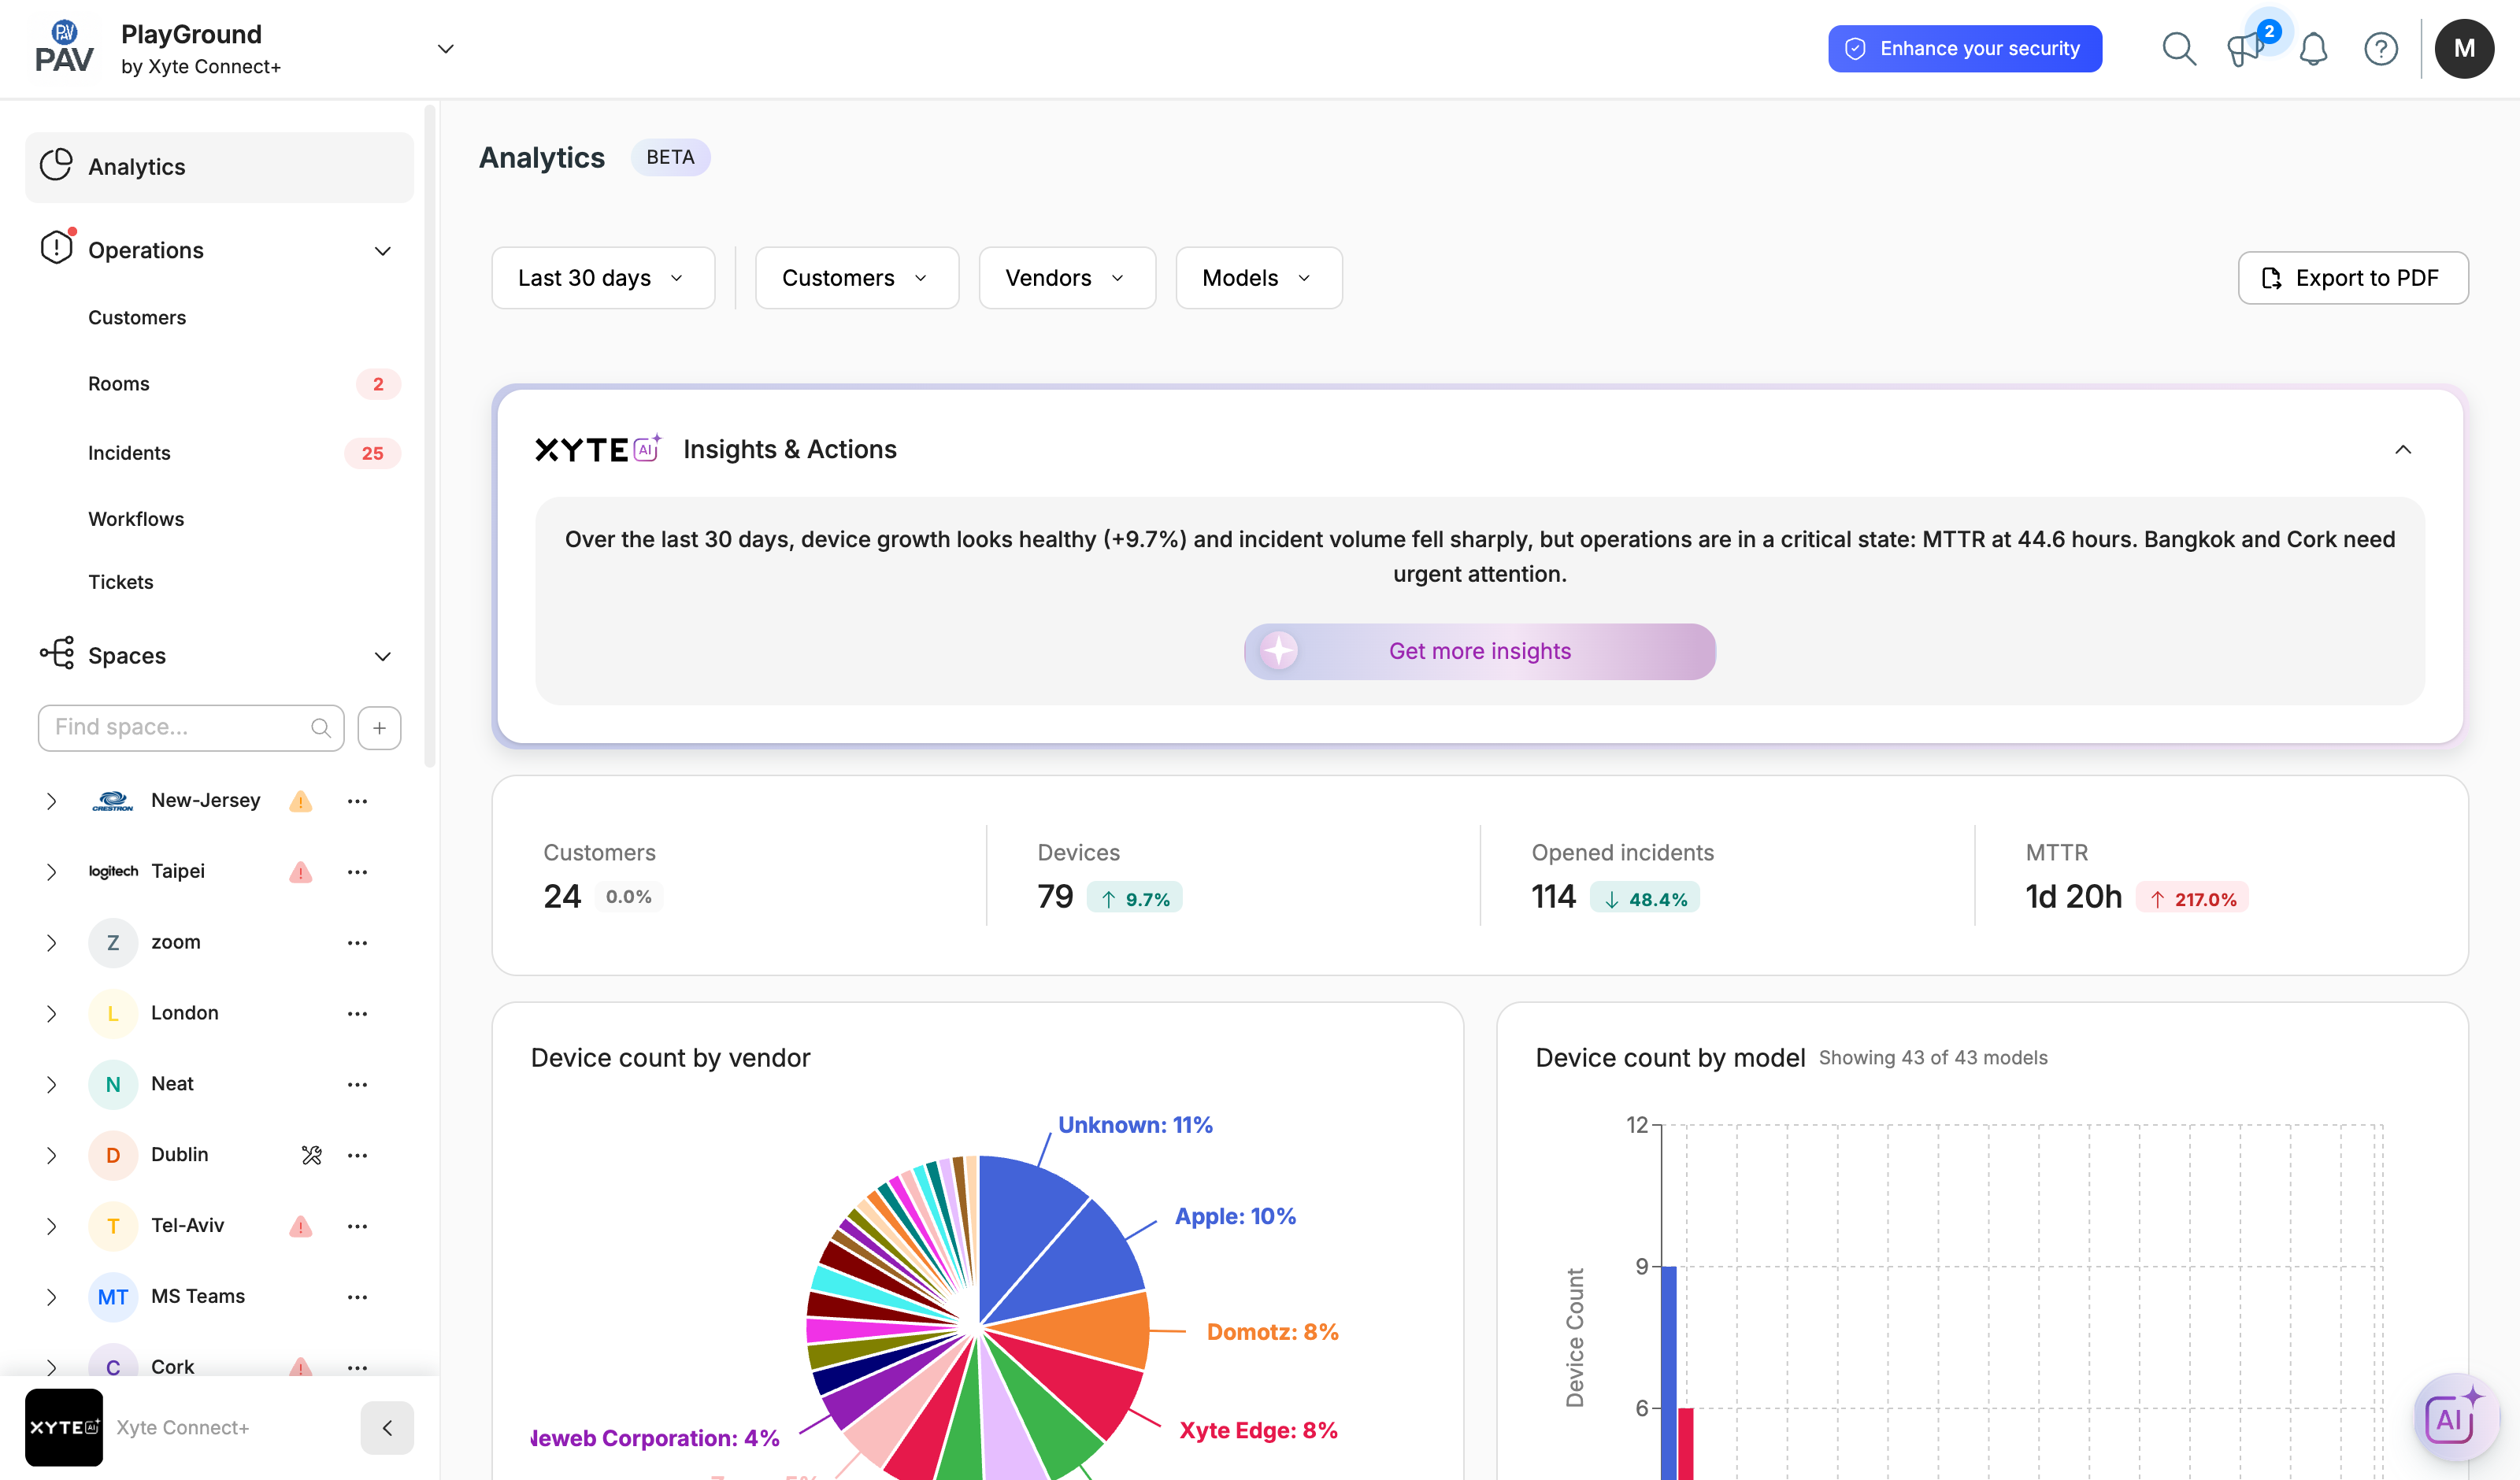
The Analytics view gives you a portfolio-wide picture across every customer — device and customer counts, incident volume and MTTR — with an AI summary on top. Analytics is currently in Beta.
Filtering
Scope the view with the controls at the top:
- Time range (e.g. Last 30 days)
- Customers, Vendors and Models
Use Export to PDF to save or share a snapshot of the current view.
Insights & Actions
The Xyte AI panel summarizes the selected period — device growth, incident trend and MTTR — and calls out the customers that need attention. Get more insights opens a deeper AI breakdown.
Key metrics
At-a-glance tiles, each with its change vs. the previous period:
- Customers — how many customers you manage
- Devices — total managed devices
- Opened incidents — incidents opened in the period
- MTTR — mean time to resolution
Charts
- Device count by vendor — your fleet broken down by manufacturer
- Device count by model — device counts per model
Additional charts (incidents over time, MTTR trends, and more) appear as you scroll.
Updated about 1 month ago
Did this page help you?