Widget details
Learn more about dashboard widgets.
Some of the widgets provide access to a lot of useful information and functionality that allows for easy decision making, management, and navigation. This section focuses on these widgets.
Devices
The following image shows the functions and menus accessible through the Devices widget in the dashboard.
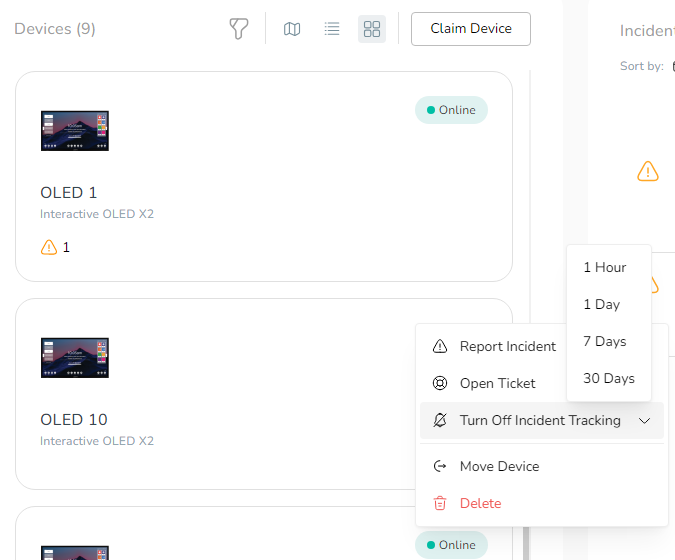
Within this widget:
- The top menu allows you to:
- Filter devices by name, model, or status.
- Choose how to view the devices in the widget: map, list, or grid view.
- Claim a device for the selected space by clicking the Claim Device button.
- The status of each device is displayed as Online, Offline, Error or Unavailable.
- Incidents on the device are highlighted using a color-coded warning icon. Hover over the icon to reveal the severity level: low (gray), moderate (yellow), high (orange), or critical (red).
Hovering over a device in the widget reveals an ellipsis (...), which gives you access to the following menu items:
- Report Incident: Report an incident on the device.
- Open Ticket: Open a ticket to notify the manufacturer of an issue on the device.
- Turn Off Incident Tracking: Turn off incident tracking for the device for 1 hour, 1 day, 7 days, or 30 days.
- Move Device: Move the device to a different space.
- Delete: Delete the device from the selected space. This changes the device’s status from Claimed to Registered, so it can be claimed by another space.
Clicking a device in the widget takes you to the device’s details screen, where you can access additional information about the device.
Incidents
The image below shows an example of the information contained in the Incidents widget
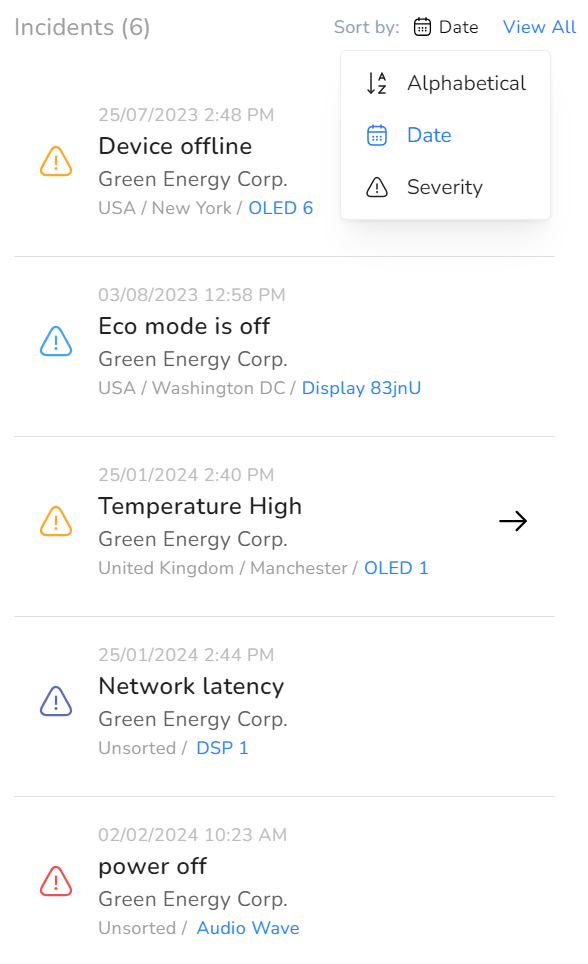
This widget displays all incidents for a selected space and/or its sub-spaces. Each incident has a descriptive name and is marked with a severity level, the date and time at which the incident was reported, the company name, the path to the space that has claimed the device, and the name of the affected device.
Incidents can be sorted alphabetically by name, by date, or by severity.
Click the right arrow that appears when you hover over an incident to open the Incident Information screen, which shows detailed information about the incident. Here, you can choose to escalate or close the incident. Note that the Close button is used not to close the screen, but to close the incident. An incident that is closed cannot be reopened. Read more about Incidents.
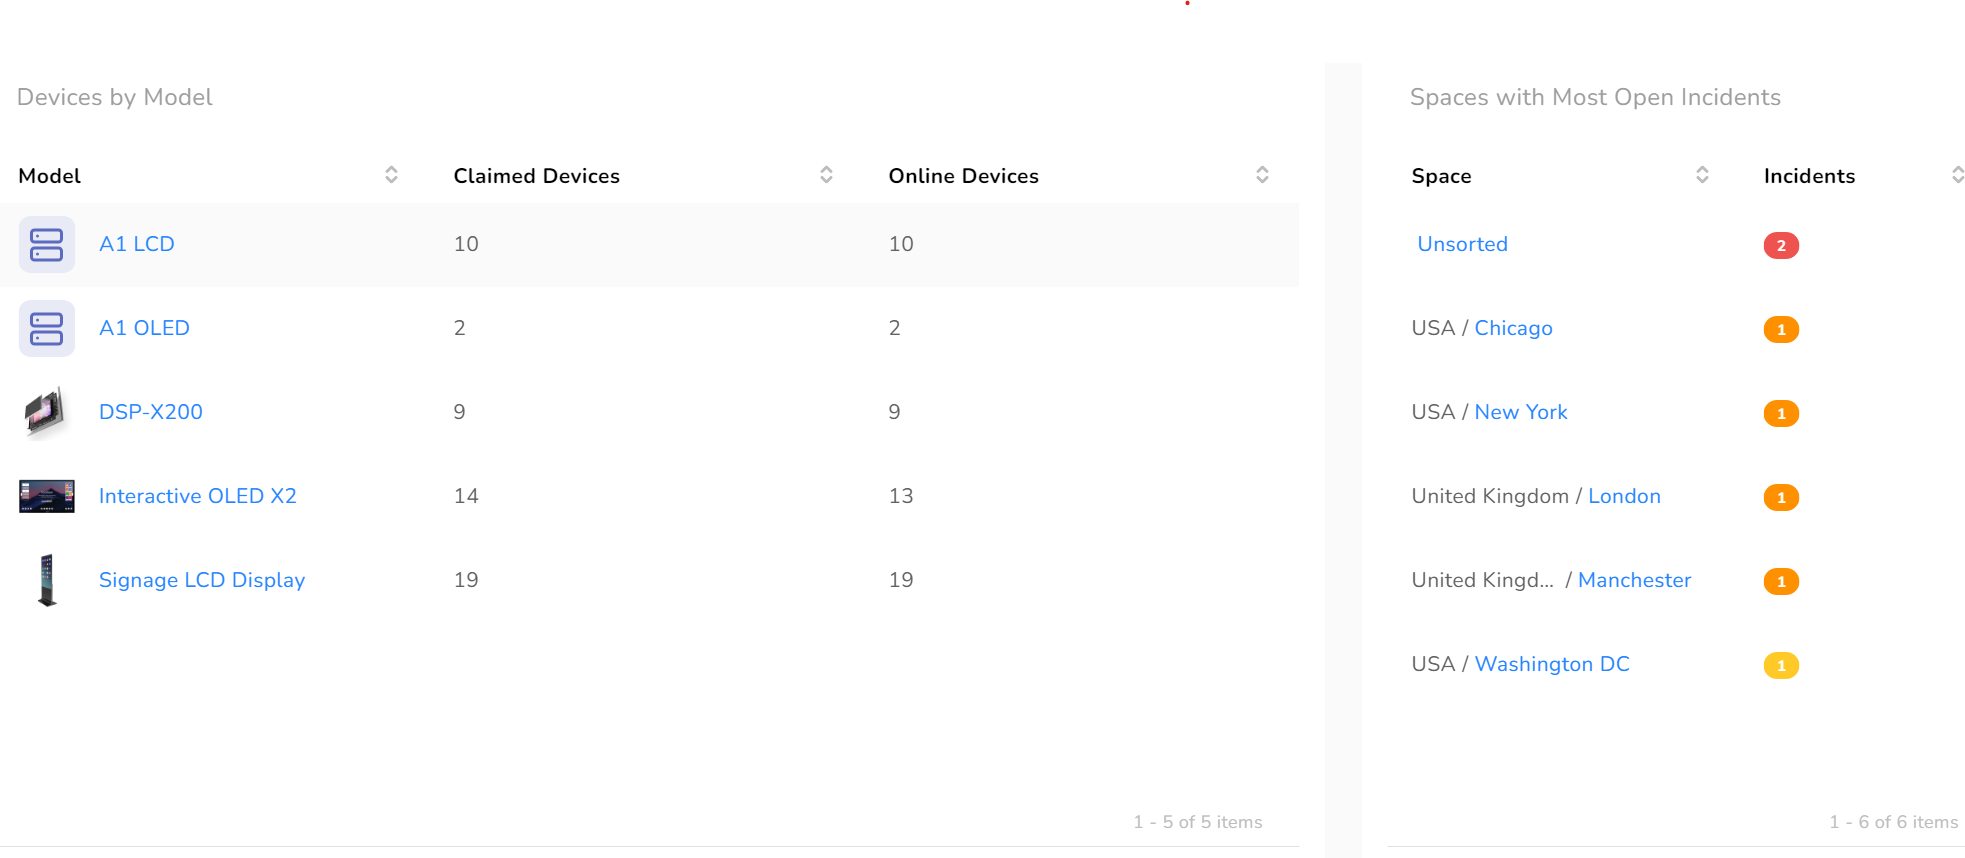
Devices by model
This widget reports on devices by model. In the following image, for example, there are 10 devices of model A1 LCD. They are all claimed and online. The number indicates how many incidents the device is experiencing, and the color indicates the most severe incident. So, in the image below, the device, A1 LCD, has 2 incidents of which at least one is severe (red). Read more about Devices.
Space-related options
The ellipsis next to the Edit dashboard button provides access to the following additional options:
- The Set Maintenance lets you pause all notifications while carrying out work to resolve an issue.
- The Settings option allows you to make changes in three areas that apply system-wide:
- Space
- Incident Routing
- Access